Graph showing the evolution of Castilian guard payments in 1523 and 1524

Graphics
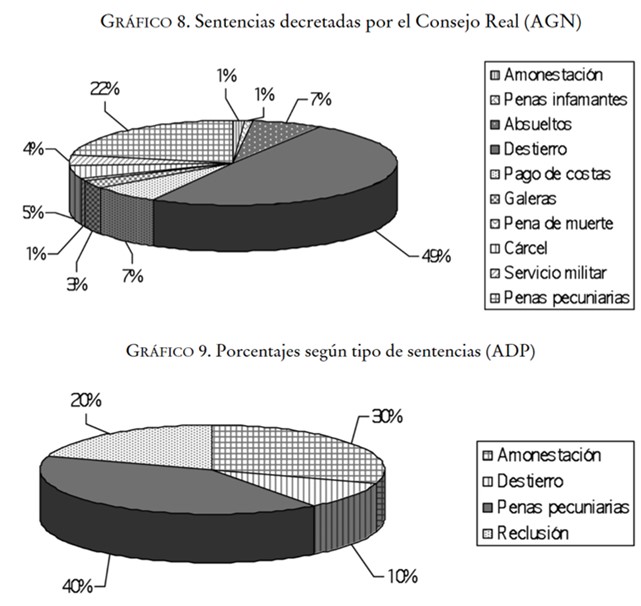
Graphs reflecting the nature of the penalties imposed by civil and ecclesiastical courts in modern Navarre. The divergence of penalties according to the jurisdiction of the judiciary stands out
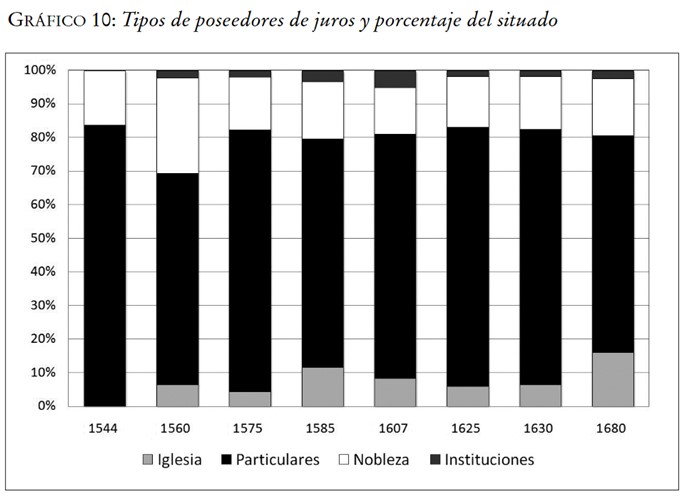
Graph showing the typology of juros holders: private individuals, church, nobility and other institutions. The importance of the juros as a source of long-term financing for the monarchy
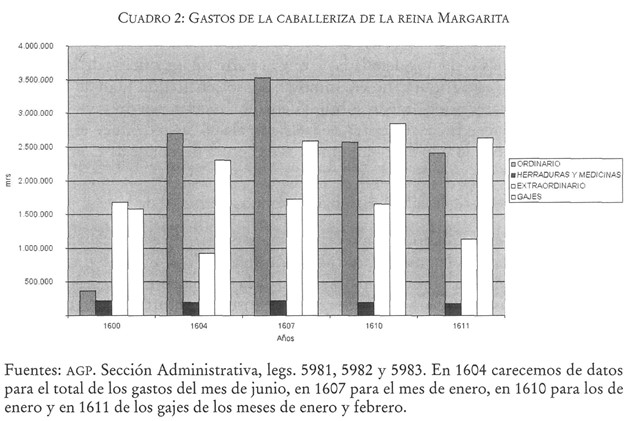
Resource showing the expenditure of the section in charge of the public representation of Queen Margaret, wife of Philip III: the stables
Graph on the type of snowfalls in Burgos between 1651-1810
Chart of those executed in Valencia between 1450-1500
Trajectory of the children who joined the Pious Work between 1700 and 1791
Bar chart showing the extraordinary resources raised to try to pay for the Nine Years’ War by the French monarchy
Graph showing the evolution of mortality, birth rate and marriage rate in Hoyos to reflect the changes that took place around the War of Independence in 1808
Line graph showing the percentages of consanguinity and homonymy in the Cantabrian partentescos of the Iguña Valley for the 17th century
Page 4 of 13