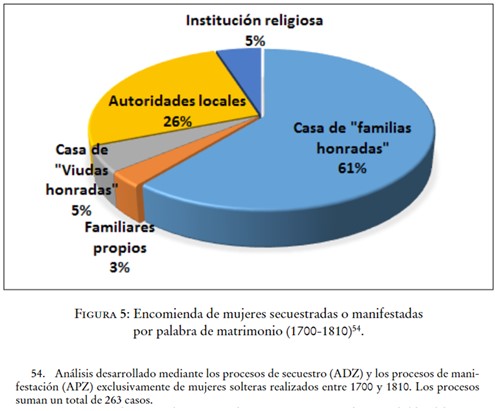
Graph showing the custody fate of women “abducted” as a legal formula for marriage against the will of the parents

Graphics
Line graph showing the evolution of the population considered elderly in Fermoselle between 1750 and 1825
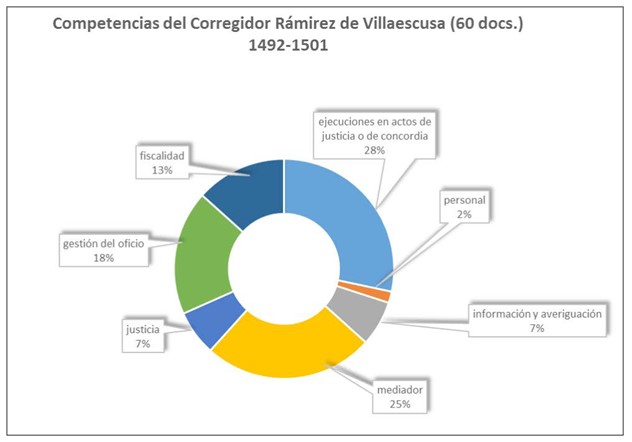
Resource that classifies the scope of action of a corregidor of Valladolid, highlighting his work as a justice, mediator and manager
Pie chart showing the origin of the commercial vessels that arrived for the Cernesio family in 1615
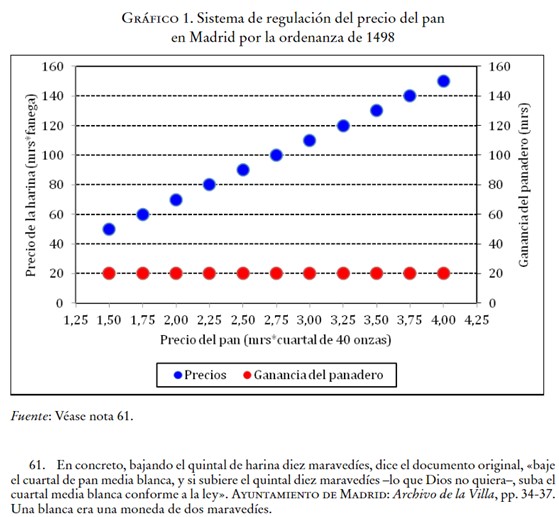
Resource showing the equivalence of the price of bread according to the municipal ordinance of Madrid of 1498, which related the prices of this product to those of its raw material: flour
Bar chart showing the evolution of loan payments by Charles V between 1540 and 1554 to German, Genoese, Castilian and Flemish lenders
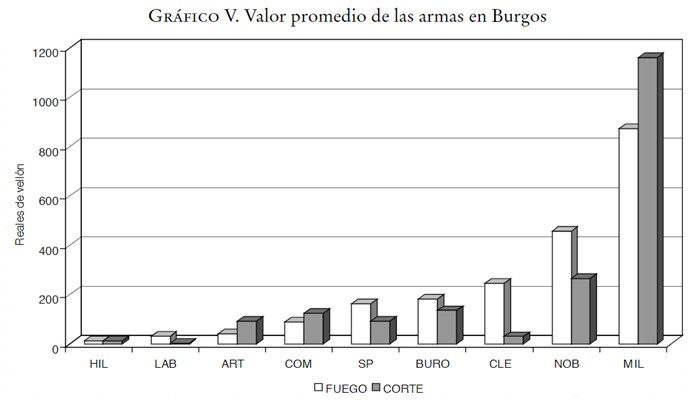
Graphic resource showing the close relationship between the quality of firearms and bladed weapons through their average value, with the socio-economic groups of Burgos society during the 18th century
Line graph comparing publishing production on Turkey and the Indies between the end of the 15th century and the first half of the 19th century
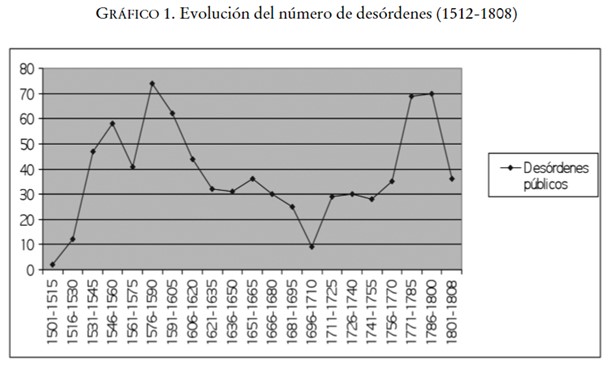
Graph showing the evolution of lawsuits, both in civil and ecclesiastical justice, in the kingdom of Navarre during the modern period. It can be seen that the end of the Ancien Régime brought with it an increase in social conflict, mainly involving young people
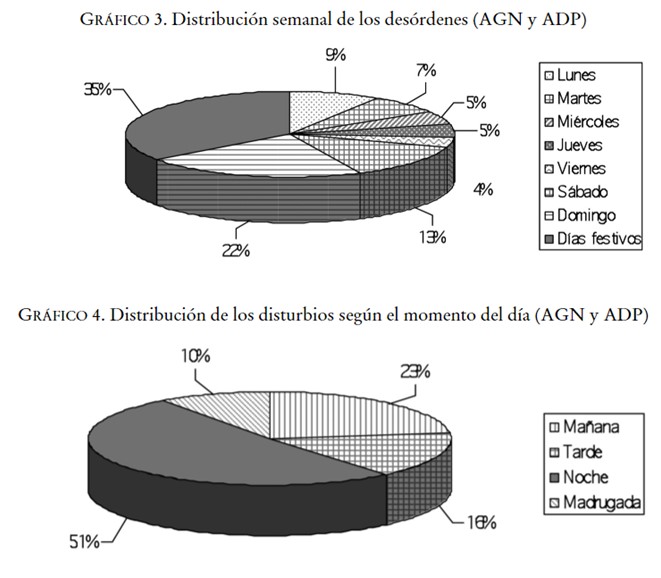
Graph showing the number of altercations that took place on each day of the week and the times at which they occurred. The resource also refers to the most conflict-prone months; those that hosted events that mobilised the local community
Page 5 of 13