Line graph showing the average price of sheep pasture and apiary in Vera (Almería) during the 16th century

3. Rural world and urban world in the formation of the European identity.
Graph showing the evolution between 1575 and 1599 of deaths and baptisms in the parish of San Salvador de Villafáfila (Zamora)
Line graph showing the evolution of university enrolment in Salamanca between 1551 and 1596
Graph showing the percentage of inbred marriages in Potes and Liébana between 1600 and 1850
Graph showing the price of bread in Trujillo (Cáceres) during the second half of the 16th century and the beginning of the 17th century
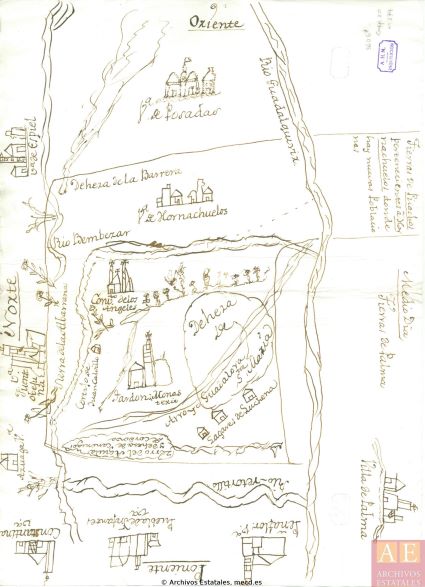
The image shows a plan-drawing of the Nuevas Poblaciones de Sierra Morena in the 18th century. Extensions of the municipal district of Hornachuelos (Córdoba) are depicted.
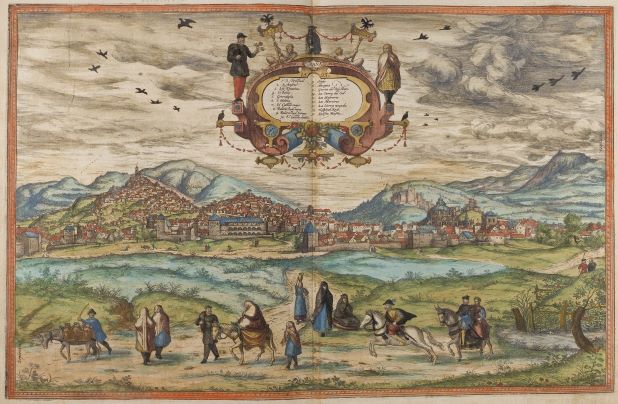
The image represents a view of Granada from the work Civitates Orbis Terrarum, by Georg Braun and Frans Hogenberg, produced around 1572. This work contains more than 500 perspectives, aerial images and maps of cities around the world.
Trajectory of the children who joined the Pious Work between 1700 and 1791
Graph showing the evolution of mortality, birth rate and marriage rate in Hoyos to reflect the changes that took place around the War of Independence in 1808
Line graph showing the percentages of consanguinity and homonymy in the Cantabrian partentescos of the Iguña Valley for the 17th century
Page 34 of 58